How independent benchmarking can benefit your farm

Drive through the countryside with any farmer and you’re almost guaranteed a passing comment on the surrounding crops. Scathing or otherwise, we all judge ourselves on the job in hand by comparing our success against the performance of others.
Others will visit, read or watch how different farms operate across the country, drawing lasting impressions often affecting the way they themselves grow crops.
Benchmarking can bring specific detail to watching over the hedge and is perhaps the most valuable tool for pinpointing different practice and anticipating future trends.
Wilson Wraight has been benchmarking data on an independent basis for more than 15 years, using business performance data gathered from hundreds of our clients.
Today that database forms a vast resource which underpins analysis and advice. It provides valuable insight into the underlying trends, putting into context year-on-year income and cost variations. Comparative summaries give different measures of performance, including gross margins, yield and operating costs across different farming scales, practices and soil types.
We input and manage data ourselves on a single database and to our own criteria. It’s an impartial, fair and consistent method which leaves no room for misinterpretation, making it extremely reliable.
Farmers receive individualised, comparative information allowing them to benchmark their enterprise against other businesses on both a financial and productivity basis. Only they can see information relating to their farm; all data in the public domain is released on a confidential and anonymous basis.
The summaries are displayed in graph form, colour-coded for ease of interpretation. Farmers can relate to specific information identifying changes such as funding requirements, whilst comparing their costs and yield with other similar farming ventures.
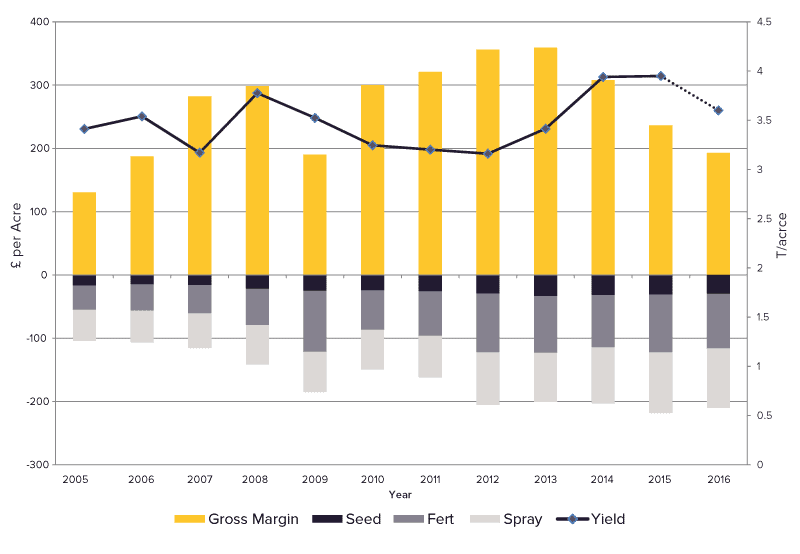
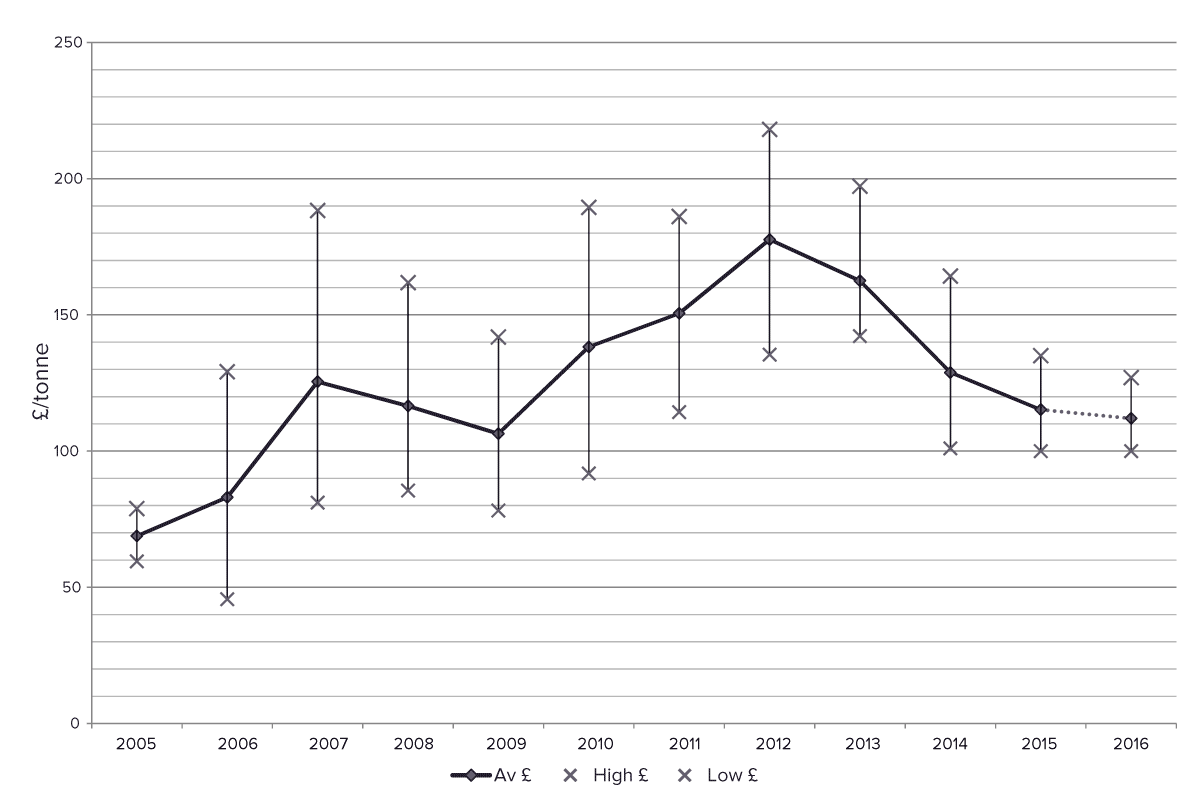
As illustrated in Graph 1 below, yield (the purple line) is not the main factor in determining good gross margin (yellow bars). Instead, overlay the wheat value per tonne (graph 2) for the last ten years onto graph 1 and you will see a far stronger correlation.


The focus of today’s more successful farmers is moving away from yield chasing and towards margin managing. Effective crop marketing is essential and farmers must be aware of all options available to them when forming a grain sales policy.
Interestingly, the first graph shows spray costs have remained high for the last few years regardless of the season, yet we have had some years of high disease and extreme low disease. In 2013 many untreated trials performed better than those with expensive fungicide programmes, yet a pre-emptive protection programme can remain costly.
When benchmarking shows we’re not getting the right margin, we ask questions. It might be that the farmer needs to review suppliers, for example, or his seed outlay, or look to make improvements to his storage procedures.
We also interpret the data to estimate performance during 2016, which again allows farmers to anticipate and better manage their farm’s yield. The faded forecasts on the graphs are formed from the following factors:
- A more average yield is forecast which, combined with poor prices could see a below par gross margin performance at around 2009 levels, when the average sales price was £108/tonne. The last similar level was reached in 2006, when wheat averaged £82/tonne.
- Costs for fertilisers are expected to reduce slightly as the price of Nitrogen continues to fall; however, an increased use of compound products and large amounts of milling wheat planted compared to previous years could curb some savings. Spray expenditure is expected to rise with inflation in many cases. Overall spray expenditure in recent years has been less reactive to growing problems in crops but more precautionary which consolidates a high level of cost regardless of the season.
Every client using our budget and report service receives a hard copy of his or her own personal data every year, presented in acres or hectares, depending on their preference. They also receive performance data of other crops, so they can be fully aware of the latest performance figures.
The service is also particularly useful in the case of contract farming, so landowners can assess how contracted farmers are performing.
Farmers who use Wilson Wraight budgeting and reporting tools can utilise this rich database to make well-informed decisions. The trends information can help them budget and plan for future years, measuring and predicting income and costs to help them set realistic performance targets.
Each farm is unique – but benchmarking is an extremely valuable way of pinpointing where improvements can be made. It’s one of the many tools we draw on to give specialist analysis and advice, tailored to bring out the best in every venture.
